Macro-02: The Long Run, or One Pie and Three Eaters
First midterm territory~50 min with interactivestrains 5 of 16 mock-1 questions
In this lesson
Why long-run output is a fixed pie, and what fixes it
The three eaters: consumption, investment, government
The rent on money: what r actually is, told through one pizza oven
The project ladder: a widget where you build the investment curve with your own hands
The pantry: where saving goes, why S = I is one handshake, and a day at the counter that shows equilibrium happening
The pantry market: a loanable-funds machine with fiscal levers you pull yourself
Crowding out, the idea behind a third of the first midterm's model questions
Before you start, three things you already own
from Macro-01 GDP is production, income, and spending at once. Y = C + I + G (+ NX, dropped here to keep the economy closed). Today Y itself stops moving: the whole chapter asks who gets the fixed total.
from Macro-01 Real vs nominal. This chapter lives in the long run, where prices have finished adjusting. Every quantity here is real, and the interest rate r is the real one.
from Macro-00, pattern 3 "Which way does it move?" Every exam question on this chapter is that pattern: a policy changes, and you say which way r, I, C, S go. The machine below trains exactly that reflex.
The town that bakes one pie
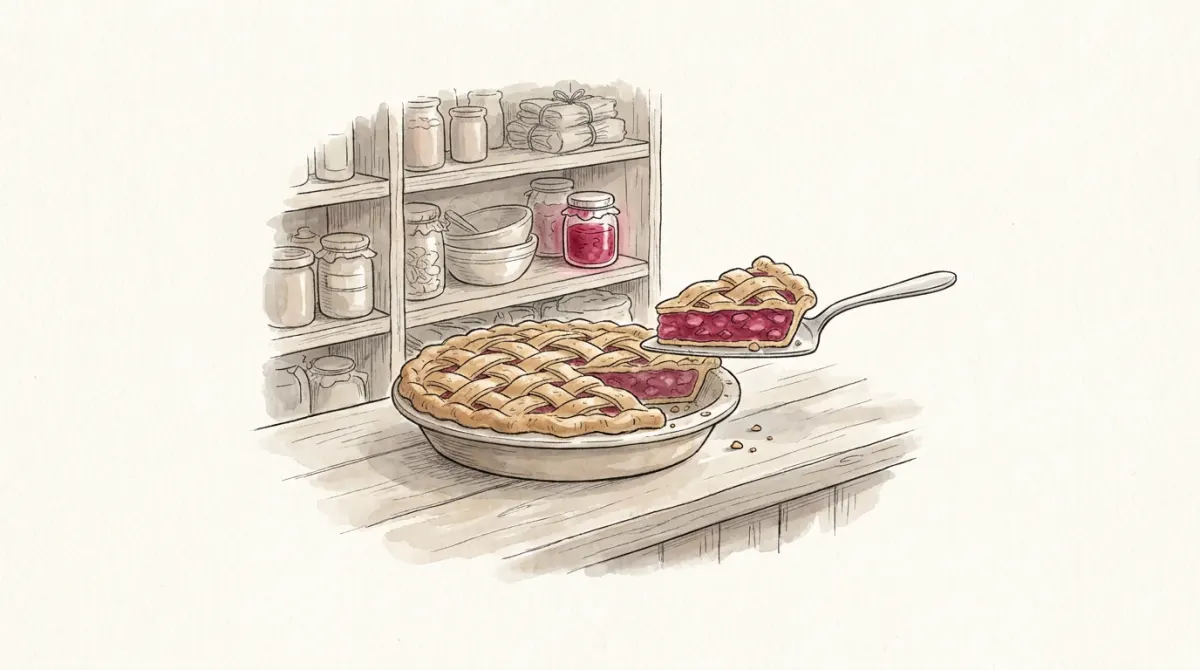
Picture a small town with one giant communal oven. Every year the town bakes one pie. The size of that pie is decided by three things and three things only: how many ovens the town has, how many bakers show up, and how good the recipe is. Not by wishes, not by the mayor, not by the price of pie.
That is the long-run economy. In the notation of the course:
Y = F(K, L)
K is capital: the ovens. Machines, tools, buildings.
L is labor: the bakers. Everyone's working hours.
F is the production function: the recipe. It stands for the technology that turns ovens and bakers into pie.
In the long run all three are taken as fixed, so output is a fixed number: Y = Ȳ. Economists write the bar on top to say "this one does not move today". The pie is baked; the interesting question becomes who eats it.
Why "long run" means flexible prices
Short run and long run are not calendar labels; they are statements about prices. In the short run many prices are stuck (contracts, catalogs, menus). Given enough time, everything gets renegotiated and reprinted, markets clear, and production settles at what the ovens, bakers and recipe allow. Chapters 4 to 8 of the course all live in this flexible-price world. The sticky world is Macro-05's.
Three eaters at the table
The pie gets eaten by three groups, the same three spenders you met in Macro-01's GDP formula:
C, consumption: households. They eat out of disposable income, meaning income after taxes, Y − T, where T is total taxes. The rule is a straight line: C = C̄ + MPC·(Y − T). Here C̄ is baseline consumption, the eating that happens no matter what, and MPC is the marginal propensity to consume, the share of each extra euro of disposable income that gets eaten rather than saved. If MPC = 0.6, an extra €100 in pockets means €60 more consumption and €40 more saving.
I, investment: firms and home-builders. They buy new ovens, machines, houses, almost always with money that is not sitting in their pockets, and that single fact makes investment depend on the real interest rater, the price of using money. This dependence matters so much that the next two sections do nothing but unpack it: first what r actually is, then why cheaper money means more building. For now, just the headline: I = I(r), and it slopes down.
G, government purchases: roads, schools, salaries of public employees. Decided politically, so the model takes G (and T) as given numbers. One technical note the exam likes: G counts purchases only, not transfers like pensions or unemployment benefits, because transfers are not the government buying pie; they move income between households.
Add the plates and you get demand for pie: C + I + G. Supply of pie is the fixed Ȳ. Something has to make these equal, and it cannot be production (fixed) or prices (already done adjusting). It is the interest rate. Which means we cannot go one step further until r stops being a mystery letter.
The rent on money: what r really is
Textbooks introduce r in half a sentence and then lean on it for three chapters. It deserves a proper introduction, so here is one, with no formula in sight.
Meet Rosa, who runs a pizzeria. A new oven costs €10,000 and would bring in about €800 a year of extra profit: faster pizzas, lower gas bills. Economists compress that into one number, the return: 800 out of 10,000 is 8% a year. That number belongs to the oven. It will not change for the rest of this story.
Should she buy it? That depends on exactly one other thing: what money costs. There are two ways Rosa can put €10,000 on the counter, and neither is free:
Borrow it. Then she pays interest: with money priced at 5%, that is €500 a year for as long as she keeps the loan.
Use her own savings. This one feels free and is not: those €10,000 were quietly earning 5% somewhere (lent out, sitting in bonds). Pouring them into the oven means giving that up. Same €500 a year, just invisible. Economists call it an opportunity cost; you can call it the rent Rosa stops collecting.
Either way, using money costs r. So the whole decision is a comparison between two percentages: the oven earns 8, the money costs 5, Rosa pockets the 3 in between and buys the oven. Now rerun it with expensive money, r = 10%: the oven still earns its 8, but the money eats 10. She would lose 2% a year, every year. No oven. Nothing about the oven changed; only the price of money did.
r is a price tag, not a pile of euros
r is not the money you borrow, and it is not the euros of interest either. It is a rate: euros of interest per euro borrowed, per year, the way ham is priced per kilo. Borrow €10,000 at r = 5% and the euros of interest are 10,000 × 0.05 = €500. And notice something odd and important: in this market money is never bought, because buying money with money makes no sense. It is rented: the borrower uses it for a while, hands it back, and pays for the time it was theirs. That is why r always comes with "per year" attached, like any rent.
Out of the story falls the one sentence this whole chapter runs on:
A project happens if its return beats r. r is the bar every project in the economy has to clear.
Every project in town: the ladder that becomes a curve
Rosa is not alone. The whole town has ideas: the courier is eyeing a delivery van, the bar owner dreams of a karaoke stage. Every project has its own return, so you can line them all up, best idea first. Do that, and investment stops being abstract: r is one bar, and the town's projects take turns trying to clear it.
Drag r and watch who makes it. Projects standing taller than the dashed bar get their money and get built (blue); the rest wait for cheaper money (gray).
The project ladder
Each column is one project: its width is the money it needs, its height is its return. The dashed line is r, the bar to clear.
5.0%
Now squint at the tops of the columns: they form a staircase walking down to the right. Read it sideways, the way you just used it: pick a height for the bar, and the blue stretch along the floor tells you how much money the town borrows and builds with at that r. High bar, short blue stretch. Low bar, long one.
You just built the famous curve
A real economy has millions of projects, not eight, so the steps shrink until the staircase looks like a smooth slide. That smooth staircase has a name: I(r), the investment demand curve. It was never really a curve. It is a ranking of projects seen from the side, and it slopes downward for the most human of reasons: the cheaper money gets, the more ideas are worth trying. Any time a graph in this course shows you I(r), picture this ladder.
The pantry: saving, public and private
Whatever the town does not eat this year goes into the pantry as preserves. In economic words, income not spent on consumption or government purchases is national saving:
S = Y − C − G
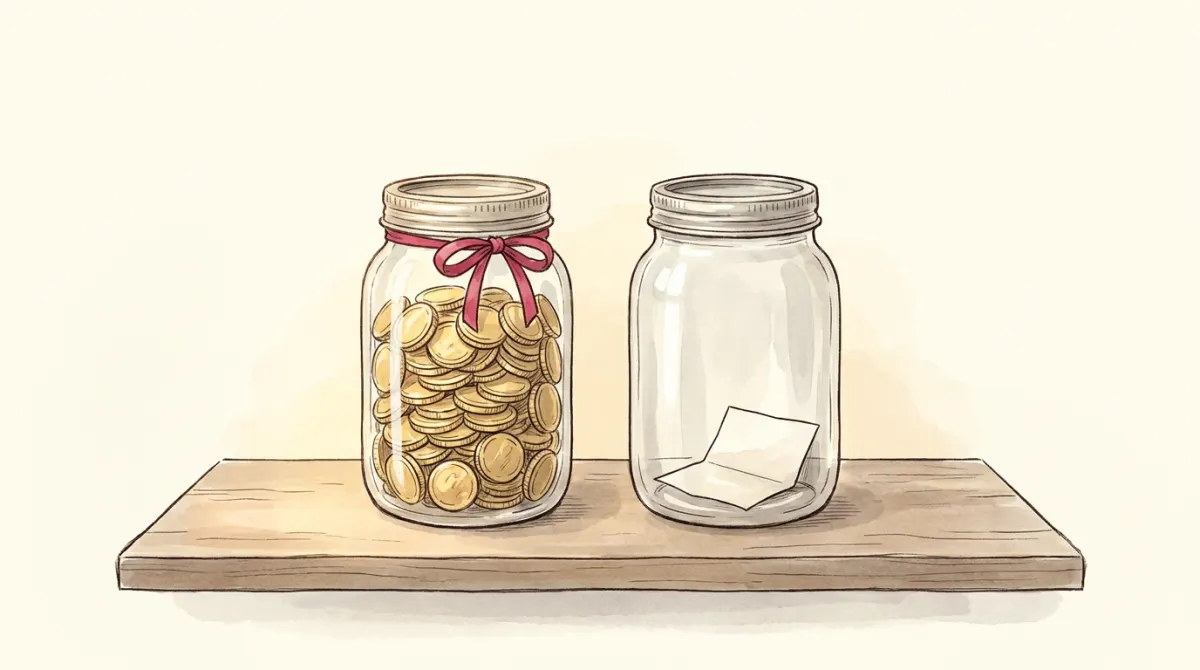
It splits into two jars:
Private saving = (Y − T) − C. What households keep of their after-tax income.
Public saving = T − G. What the government keeps of its tax revenue. When G is bigger than T this jar is negative: a budget deficit, the government eating out of the pantry. (It does so by selling bonds: BOT and BTP in Italy, Bunds in Germany, T-bills in the US.)
The pantry's two jars. Private saving is full; public saving is down to an IOU. National saving is the two added together, so a deficit quietly eats what households put away.
And who takes preserves out of the pantry? The builders. Investment is financed by borrowing saving. The pantry is the course's loanable funds market: saving supplies funds, investment demands them, and the price of borrowing them is r, the rent on money from Rosa's story. If sentences like "S = I in equilibrium" still feel like they arrive from nowhere, good: the next two sections exist to slow that exact moment down to walking pace.
A real mock-exam computation. Y = 1150, T = 300, C = 765, G = 310. National saving?
1. S = Y − C − G = 1150 − 765 − 310 = 75. That is the whole answer, worth one full point.
2. For understanding, split it: private = (1150 − 300) − 765 = 85. Public = 300 − 310 = −10, a deficit.
85 − 10 = 75. Households filled the pantry; the government quietly ate a jar. Watch the distractors: the exam offers 85 and −10 as wrong options, hoping you stop halfway.
Why S = I: one handshake, two ends
Here is a claim the book states as if it were obvious: in equilibrium, saving and investment are equal. Not similar, not related. The same number. Which is strange, because they are clearly two different ideas, done by different people, for different reasons. Why on earth would they match, and why use two letters for one number?
Ask a market inspector a parallel question: "80 apples were sold at the market today; how many were bought?" 80, obviously. Not because selling and buying are the same concept: the farmer sold to pay her rent, the customer bought to make a crostata. Two decisions, two motives, two words. But every sale is a purchase. They are the two ends of one handshake, one event counted from the two sides of the stall, and there is simply no way for the numbers to differ.
Now put one euro under the microscope. Anna earns €100, pays €20 in taxes, spends €60 at the shops, and brings the last €20 to the pantry counter in the morning. That is saving: money earned and not eaten. In the afternoon, the counter lends those same twenty euros to Bruno, who buys bricks for his workshop extension. That is investment: money poured into something that will produce for years. Anna's saving and Bruno's investment are the same €20, a few hours apart. Add up every Anna and every Bruno in the country and you are adding up the same handshakes twice: once from the givers' side, and the total is called S; once from the builders' side, and the total is called I.
One handshake, two names. The saver's euro and the builder's euro are the same coin: count it from her side and it is called S, from his side and it is called I.
And if money feels too slippery, hold the pie instead. The town baked 1000 this year. Households ate 600, the government ate 200. The 200 nobody ate did not evaporate: look around, there it stands, as this year's new ovens, machines and half-built houses. "Saving" is that slice named by the people who gave it up. "Investment" is the same slice named by the people building with it. Two letters because two points of view; one number because it is one slice of one pie.
A day at the pantry counter
Diagrams show equilibrium as a finished photograph: two lines, a crossing, done. What gets cut is the film, the minutes in which things actually happen, and that cut is exactly where the "big jumps" feeling comes from. So here is the film, uncut.
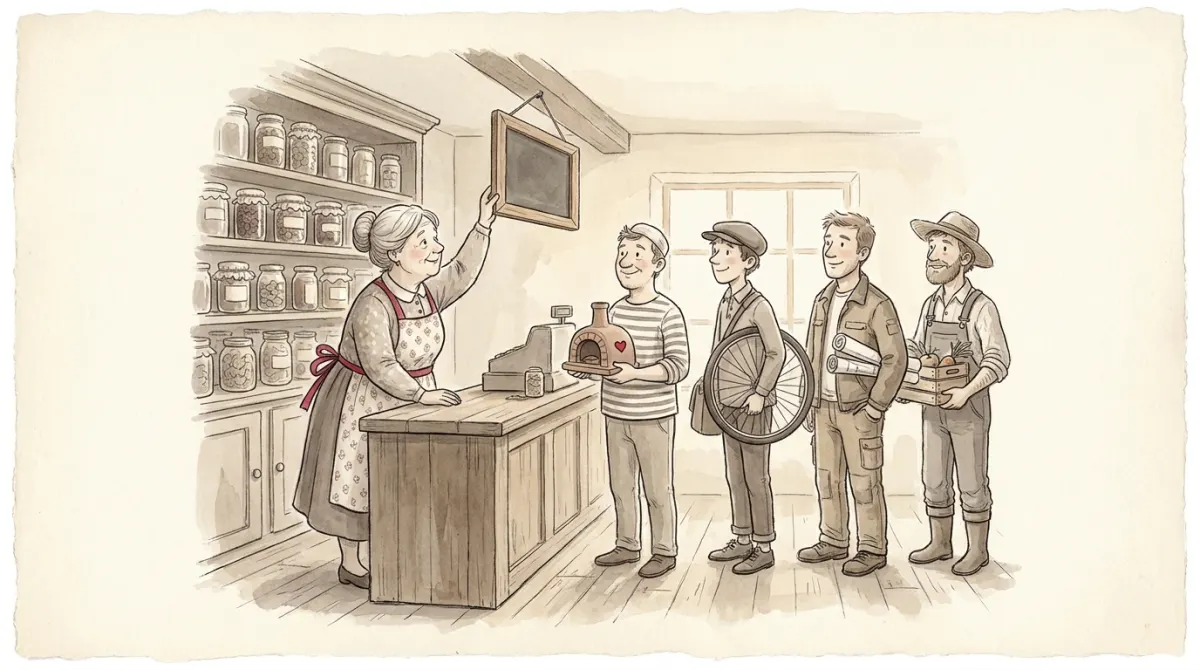
All the town's saving sits in the drawer behind the pantry counter: 220 this year. The keeper's job is to lend it out, and her only tool is the little chalk sign with today's price of money. For years the routine is the same: the sign says 4%, and at 4% the queue at her counter asks for exactly 220. The drawer empties, the door closes, everyone home for dinner.
The loanable funds market, in person. The drawer holds the town's saving, the queue holds its projects, and the keeper's chalk sign is r. Her whole job is choosing the number that makes the queue exactly as long as the drawer is deep.
Scene one: the boom. The internet arrives. Overnight, ideas that were daydreams start looking like gold mines, and the next morning the queue is out the door: at 4%, it asks for 280. But the drawer holds 220, same as always. What does any shopkeeper do with a queue out the door and limited stock? She raises the price. Sign goes to 5%: the weakest projects redo their math and walk home. Still too long. 6%: now the queue asks for exactly 220. Closing time: 220 lent, precisely like every other year. What changed is the price, and who got the money: only the strongest projects cleared the higher bar. That is the whole answer to the exam's favorite trap: a tech boom moves r, not I.
Scene two: the gloomy year. Confidence collapses, and at 4% the queue asks for a mere 150. Now the keeper has stock left in the drawer at closing time, and she does what every shopkeeper does with unsold stock: she cuts the price. 3%. 2.5%. Every cut lowers the bar, and projects that had given up drift back into the queue, until the last euro in the drawer finds its borrower.
Put the two scenes together and you have the deepest fact in this chapter, the one that makes everything else click: no euro sleeps in the drawer. Not out of anyone's generosity. Emptying the drawer exactly, no leftovers and no shortage, is r's entire job, and "equilibrium" is not a place: it is the number on the chalk sign at the moment the haggling stops, when the queue and the drawer finally match.
"But in real life money does sit still..."
Correct, and if that objection occurred to you, keep it: it is not a mistake, it is a preview. People hold cash, banks hold reserves, and the desire to keep money idle instead of lending it is precisely the engine of the short-run model waiting in Macro-05. This chapter lives in the long run, where every price, r included, has finished adjusting, so every euro has found a home. When prices freeze, money really can stop moving, and a very different machine takes over the economy.
The pantry market, live
The diagram below is the film's final frame, photographed and stamped with official names, and you already know everyone in the picture. The amber vertical line is the drawer: saving, standing at the same spot whatever the sign says, which is exactly why it is drawn vertical. The blue curve is the queue: the project ladder from earlier with its steps smoothed out, showing how much would be asked for at every possible price of money. The dot is closing time, the deals actually signed. Above the graph, the pie shows who is eating what.
How to read any economics graph (30 seconds, pays for the whole course)
In school, graphs answer with height: the result lives on the vertical axis. Economists, by an 1890 convention the world is now stuck with, flipped it: the price goes on the vertical axis, the quantity on the horizontal. So on every diagram in this course, the answer to "how much?" is read sideways: left means little, right means lots. To ask the blue curve a question, make three moves: pick an r on the vertical axis, walk right until you hit the curve, drop straight down. Where you land is how much the queue wants at that price. One more distinction and you are armed for the exam: the curve is a wish list (what would be asked at every possible price), the dot is what actually happens. When a question says demand rises "for any given r", it is moving the whole wish list; when it asks "what happens to investment?", it is asking about the dot.
The pantry (loanable funds market)
The pie, Ȳ = 1000: C · I · G
C
I
G
S: the drawer (saving, vertical) · I(r): the queue (investment demand) · gray dashed = where you started
200
200
The one trap worth €1
Press "Investment boom". Firms want more machines at every r: the queue lengthens, the blue wish list jumps right... and the dot? It can only slide up the amber line, because the drawer still holds 220. The keeper raises the sign from 4% to 6%, the extra dreamers walk home, and equilibrium investment ends exactly where it started. On the mock this is question 6, and "I increases" is the tempting wrong answer: it confuses the wish list with the deals signed at closing time. The right answer: I remains unchanged, r does all the moving. (It would change only if saving responded to r, an extension the slides mention.)
Crowding out, with real 1980s data
When the government eats more pie without collecting more taxes, the pantry empties, borrowing gets pricier, and builders build less. Government spending crowds out investment. This is not just a diagram; the slides check it against the Reagan years, when US defense spending rose and taxes were cut at the same time:
1970s
1980s
the model says
T − G (public saving, % of GDP)
−2.2
−3.9
deficit widens
S (national saving, % of GDP)
19.6
17.4
saving falls ✓
r (real interest rate, %)
1.1
6.3
rises ✓
I (investment, % of GDP)
19.9
19.4
falls ✓
Every arrow the pantry predicts shows up in the data. This is what the course means by "taking a model to the data", and it is the story to have in your head when a question starts with "the government increases spending" in a long-run chapter.
Direction drill
The reflexes, isolated. Long run, fixed pie, one change at a time. And one master question sorts every item before you even look at the options: does the shock touch the drawer? S = Y − C − G, so check whether the shock moved Y, C or G. None of the three → the amber line is nailed down, I cannot change, only r moves (the dot climbs or slides down the line). One of them → S shifts, and I follows the drawer (the dot slides along the blue curve instead).
Cheat sheet
Everything this lesson asks you to remember
Change
S line
r
I
C
G↑ (T fixed)
left
↑
↓
unchanged
T↑ (G fixed)
right (by MPC·ΔT)
↓
↑
↓
Investment boom (I curve right)
does not move
↑
unchanged
unchanged
MPC↑ / saving incentives↓
left
↑
↓
↑
National saving
S = Y − C − G
Private / public split
(Y − T) − C and T − G
Consumption rule
C = C̄ + MPC·(Y − T)
Pantry equilibrium
S = I(r), and r is the price that clears it
What r is
the rent on money, in % per euro per year; a project happens if its return beats r
Why S = I
one handshake, two ends: every euro borrowed is a euro someone saved
Curve vs dot
curve = the queue's wish list at every price; dot = the deals actually signed
The master question
did the shock move Y, C or G? No → only r moves. Yes → S shifts and I follows
One subtraction, one straight line, one crossing point. That is the entire long-run model.
Exam-style quiz
score: 0
Six questions, real mock-exam style: +1 right, −⅓ wrong, 0 skip.